U.S. acreage pendulum swings back toward soybeans in 2026/27: drivers and consequences — ASAP Agri
While the market waits for the USDA Prospective Plantings report on 31 March, early signals already point to a shift in U.S. acreage this year.
At the USDA Agricultural Outlook Forum in February, the first projections for the 2026 planting season suggested a clear adjustment: less corn, more soybeans, says Victoria Blazhko, Head of Editorial, Content and Analytics at ASAP Agri. After a year when corn dominated the landscape, American farmers appear ready to rebalance their fields.
Corn planted area is expected to decline to 38 MHA, down 1.94 MHA from last year’s record 40 MHA. Soybean plantings, meanwhile, may rise to 34.4 MHA, up from 32.9 MHA in 2025.
On paper, the rotation may look modest. But at a global scale, even a few million hectares in the United States can shift millions of tons of supply.
Why farmers are shifting
The drivers behind this rotation are primarily economic rather than agronomic.
The 2025 season delivered a record U.S. corn crop of 432 MMT, leaving the market with comfortable inventories and putting pressure on prices. When storage bins are full, and futures show little upside, farmers do what they always do — they recalculate margins.
Corn remains one of the most expensive crops to grow in the U.S. Midwest. High fertilizer requirements, costly hybrids, machinery and fuel make corn significantly more expensive to produce than soybeans.
According to estimates by the American Soybean Association, projected losses in 2026 could reach around 213 USD/AC for corn (≈46 USD/MT) compared with 139 USD/AC for soybeans (≈97 USD/MT).
In practice, farmers make decisions based on profitability per acre, and in a margin-tight environment soybeans appear to be the less painful option.
Another factor is crop insurance economics. For the 2026 season, USDA crop insurance reference prices are set at 4.62 USD/BU for corn (≈182 USD/MT) and 11.09 USD/BU for soybeans (≈407 USD/MT), offering relatively stronger revenue protection for soybean producers.
Fertilizer costs are also adding pressure. Risks to nitrogen fertilizer supply chains have pushed urea prices up by 60–80 USD/t, with U.S. prices exceeding 500 USD/t. Because corn requires significantly more nitrogen than soybeans, rising fertilizer costs further tilt the economics toward oilseeds.
Soybean-to-corn price signal
Another key signal American farmers watch is the soybean-to-corn price ratio, which compares soybean and corn prices on the futures market and is widely used as a quick benchmark of relative crop profitability. In simple terms, it shows how many bushels of corn are needed to match the price of one bushel of soybeans, providing farmers with a straightforward indication of which crop may offer better returns per acre.
The higher the ratio, the more attractive soybeans become relative to corn; the lower the ratio, the stronger the incentive to plant corn. Historically, ratios around 2.4–2.5 represent a neutral zone where neither crop has a clear advantage, but soybeans begin to regain competitiveness.
According to CBOT futures data, the ratio averaged 2.43 in February 2026.
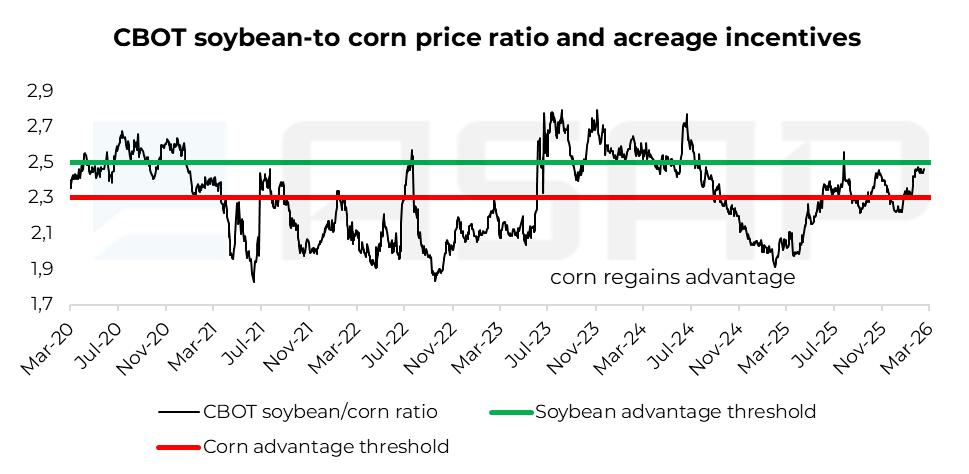
In 2024–25, the ratio fell to 1.9–2.0, reflecting corn’s relative strength amid steady demand from the ethanol and feed sectors. This environment helped drive record corn acreage.
The return of the ratio to above 2.4 signals a different market balance. Soybeans are gaining support from growing domestic processing demand, particularly linked to the expansion of renewable diesel and biodiesel production in the U.S.
As a result, the ratio no longer provides a clear economic advantage for corn, leaving room for partial acreage rotation toward soybeans.
What this means for supply
If planting projections materialize, the U.S. balance sheet in 2026/27 could shift modestly.
With lower acreage, corn production may fall to around 401 MMT, nearly 7% below last year’s level. Soybean output, in contrast, could rise to roughly 121 MMT, up 4–5% y/y.
This comes against the backdrop of steadily rising global soybean production, which has increased from 349 MMT in 2015/16 to more than 428 MMT in 2025/26, largely driven by Brazil. Corn production shows a similar long-term trend. Global output has expanded from roughly 1.02 BMT in 2015/16 to nearly 1.3 BMT in 2025/26.
However, while production of both crops continues to grow, soybean prices this season are receiving support from rapidly expanding demand in the renewable fuels sector. The average soybean price since the start of the current marketing year is roughly 20 USD/t higher than last year. Even as production in South America has surged and the U.S. share in global exports has declined, this demand continues to absorb additional supply and stabilize the market.
For corn, the picture looks somewhat different. Over the past three seasons, average CBOT corn futures prices for the marketing year have fluctuated in the range of 170–174 USD/t. Even if U.S. acreage declines, the global market would likely return only to conditions similar to the 2023/24–2024/25 seasons, when supplies remained broadly comfortable. As a result, any reduction in production may provide only limited price support compared with the more structural demand growth seen in the soybean complex.
In summary, under the current supply-and-demand configuration, soybeans appear structurally better supported over the longer term, while corn remains more dependent on supply fluctuations — reinforcing U.S. farmers’ planting intentions in favour of soybeans.