SPECIAL PROJECT

The Ukrainian Agro is not like American

Cognition comes through comparison. What is an agrarian super country? It is a country where the agricultural relative share takes 10% of GDP and agricultural export exceeds 44%. Otherwise, it is a state in which agriculture generates 1.4% of GDP and agricultural export comes up to 8.2%. To answer this and other questions, Latifundist.com and Zernotorg.ua are opening a new project "Ukraine is not …". We will compare the rates of the agrarian complex of Ukraine and other countries, looking for similarity and dissimilarity. The United States of America become the first participant of the project, where farmers cultivate 10 times more lands than in Ukraine and the share of the agricultural sector of the country’s GDP is almost twice as high as Ukrainian GDP.

The USA Agrarian Complex

The first thing that strikes while analyzing the macro indicators of the Ukrainian agricultural sector and USA is the difference in many figures by an order. It goes without saying that the territories of the countries are very different in their sizes. The United States has 10 times more agricultural land sizes unlike Ukraine. It is worth looking at the indicators of GDP created in agro per 1 ha of land or per person employed in agriculture. If the efficiency of land use in the United States is 1.6 times higher, then labor efficiency is simply over the top — the difference is 19 times. But size is not the main thing …

In addition, the agriculture and related industries generated 22.2 million working areas and $ 1.109 trillion of GDP in 2019, according to the data of USDA’s Economic Research Service. Now, pay attention! The entire GDP of Ukraine in 2019 amounted to $ 154.7 billion.
Macro indicators of the agricultural sector of the USA and Ukraine in 2019

Climate and Сonditions

In the United States, some regions specialize in the production of certain goods. These are the well-known so-called belts: corn, wheat, cotton, dairy and belt of the grassland beef farming.
Map of production belts of the USA
Map of production belts of the USA
This specialization is due to the fact that the country’s territory has a significant area, specifically 983.2 million hectares compared to 60.4 million hectares in Ukraine (according to FAO estimates). Therefore, it covers several climatic zones and landscape types. The influence of geographic and climatic factors on the formation of production belts is well traced if you look at the maps of annual precipitation and temperatures.
In recent times, however, the clear regionalization of production in the United States starts to erode due to the development of agricultural technologies. Due to irrigation, precision agriculture technologies and genetics, the crop production expands to regions where it was previously economically ineffective. For example, irrigated lands cover 22.7 million hectares (an impressive area) according to the latest FRIS USDA report for 2018. Interestingly, irrigation is developed not only in arid and mountainous states such as Texas, California, Wyoming or Montana, but also in states with sufficient annual precipitation: Arkansas, Louisiana, Mississippi, where corn and soybean fields are located along the Mississippi River. Taking into consideration the development of irrigation, as well as a powerful stock breeding complex, agriculture is the main consumer of freshwater in the country. 80% of the annual withdrawal of this valuable resource accounts for industry.

The representatives of the Amazone's office in the North America say that moisture conservation is one of the up-market topics for farmers in the United States. Large farms growing grains, soybeans and maize, try to reduce tillage to retain moisture and avoid erosion.
Today, the `smart` ZA-TS, ZG-TS distributors of fertilization are the most popular products. This is due to the growing demand for precision agriculture technologies and CATROS disc harrows, which effectively "close" moisture after harvest making the shallow cultivation.
— reported in the Amazon`s office in North America.
The large corporate farms are ranking in the vanguard of technological progress. They are the first to introduce new technologies. At the same time, American farmers invest in new equipment more extensively than European farmers and pay less attention to the cost / efficiency ratio. Many farmers are proud of using the best powerful techniques (like the 600 hp John Deere tractor). Since the country has developed a lending system of subsistence farming and operates at low interest rates, the farm, on average, changes the used agricultural equipment to new, better models every four years.
Agricultural producers in the United States focus primarily on dealers of local brands of equipment. European agricultural equipment occupies a miniscule share in the American market. Reliability, productivity and simplicity of agricultural machines are important first and foremost for American farmers. Farmers in the United States always have access to service, spare parts, and trade-in programs for the reason that equipment suppliers are usually arranged with the developed network of representative offices.
— noted Dmitry Davydenko, the CEO of Amazon-Ukraine.

Regions of concentration of agricultural production in the USA

By the way, in Ukraine you can also see the "suitability" of certain regions for their cultures.
Perhaps we do not have such a concentration of production for the individual crops in only a few areas. But, for example, a wheat belt can be distinguished (conventionally, this is the South, Dnepropetrovsk and Kharkov regions). The corn-soybean belt is located in the Center and in the North of the country. Sunflower cultivation is concentrated in the South and East of Ukraine, rapeseed — in the South and partly in the western regions.

Agricultural Production in the USA

It is no coincidence that the country’s main (profile) crops and agricultural products correspond to the names of the US production belts. Many people remember the endless fields of corn from American films or the huge herds of cattle that cowboys graze on the wild prairie. The proliferation of such television clichés is understandable as the United States is the world leader in the production and export of corn and beef.
Production of the basic agricultural products in the USA in 2019
Place in the world production
Culture
Production, thous. tons
1
Corn
Poultry meat
Beef
Sorghum
345 962
22 401
12 251
8673
2
Soybean
Chicken eggs, mln pcs.
Protein meal and seed cake
96 667
94 475
48 796
3
Milk
Sugar beet
Pork
Cotton seeds
Cotton
99 155
30 975
12 443
5393
4301
4
Peanut
2480
5
Wheat
Potato
Vegetable oils
52 581
21 561
12 661
6
Sugar
7280
8
Barley
Rapeseed
3756
1553
12
Rice
6864
Comparison of the yield capacity of the main agricultural crops in the USA and Ukraine in 2019, t/ha
Comparison of the yield capacity of the main agricultural crops in the USA and Ukraine in 2019, t/ha
In the USA, in contrast to Ukraine, there are more red soils. The red soils of Texas and Nevada are known from films even to the uninitiated. In the States, the irrigation system is very developed and a large soil fertility preservation program works in association with No-Till, Strip-Till technologies. American farmers actively use green manure (mustard, vetch, lupine, rocket cress).
— said the founder of the laboratory "Agrotest", Ph.D. Ekaterina Gubina.
A systematic approach to land-use in the United States, according to the data by Ekaterina Gubina, also includes regular studies of soils, water for irrigation, etc. … In the United States, as well as in Canada, there is a developed network of independent consulting centers that supervise farmers on agrochemical and other issues. Also there are a large number of agrochemical laboratories in these countries.
There are many complex laboratories operating in the country. Some are highly specialized in a particular culture. Actually, like the farms themselves, they are mostly highly specialized. Agrarians choose a laboratory not only in connection with its specialization but also taking into consideration its school and methodology (on the basis of recommendations).
According to her story, the country actively proposes Haneytest, an analysis of "soil health", an investigation showing as the chemical, as biochemical consistency of the soil and also its viability. As a fact, the biological activity of the soil indicates the availability of elements for plants. Based on the test results, the laboratory makes recommendations on what kind of green manure for maintaining biota, beneficial microorganisms and bacteria for soil`s "health '' is necessary for farmers.
For American farmers, soil testing is such a common procedure that costs for its research have long been included in the budgets of companies and nobody has it in mind. Every farmer has an understanding that there is no point in farming at all without such research.
— summed up Ekaterina Gubina.
In addition, according to the data of the head of Agrotest laboratory in the USA, in contrast to Ukraine, sheet diagnostics is also very popular. Ukrainian farmers overall prefer to analyze plants "by eye." The consulting centers in the USA and Canada recommend conducting the leaf diagnostics, while in our country — every farmer is his own consultant. At any rate, the land use system is changing in Ukraine and more and more farmers regularly need to study soils and plants.
I think that in 3 years it will be natural for Ukrainian farmers to do soil analysis regularly. If earlier we had to explain and prove more, so today we already talk with agrarians in the same language.
— explained Ekaterina Gubina.
Grain crops yield in 2019, thous. ha
The structure of grain production in the United States and Ukraine is similar. The largest share in the gross yield is taken by corn and wheat.
Technical crops yield in 2019, thous. ha
Technical crops in the United States are dominated by soybeans and sugar beet. Cotton and its seeds (as an oilseed crop) do also take a noticeable share. It is interesting that sunflowers are also grown in the United States. Although, the share of this crop in the structure of technical crops production in the United States is another than it is in Ukraine. The average gross yield for the last five years is about 1 million tons per year.

The absolute leader in the production of fruits and vegetables in the United States is sunny California, which accounts for about 60% of the gross yield. In general, the Southern belt of vegetable growing and horticulture has developed on the ground of the cotton belt. This is because cotton production is becoming less relevant due to the transformation of the global textile industry and other factors. The cultivation of fruits and vegetables is also well developed in the North of the country. For example, Washington State has the second largest production of fruits and vegetables. Minnesota, Michigan and New York also hold a significant share in the domestic market for fruit and vegetable products.
Annually, the USA produces 23.4 million tons of fruits and 38.2 million tons of vegetables, in Ukraine - 2.5 million tons and 30.5 million tons, consequently. That is, we are not too far behind the States in the production of vegetables. It is interesting that Ukraine and the United States are approximately at the same level, that is, in the top of five world producers on cultivation of potatoes, which is an indispensable attribute of fast foods in the form of "fries" or "peasant" in the Western food culture.

The largest regions in the United States for livestock production are Texas and California. Pig farming is concentrated in the Corn Belt, poultry farming - in the Wheat and Corn Belts, as well as on the East Coast. The cattle's farming is common in the Southwest, in some mountainous and Pacific states, in the Great Lakes region, as well as within the Corn Belt.

As in Ukraine, poultry prevails in the total meat production in the United States. But if in the States this segment accounts for 48%, then in our country - 70%. Unlike Ukrainians, Americans prefer beef as the more expensive type of meat. By the way, in the structure of production, beef and pork occupy 26% each. The United States is a net importer of beef, while export of pork and poultry significantly overrides import. Moreover, the country ranks 1st place in the world for export of meat.
Livestock production in 2019, thous. tons
In general, 60% of imports of agricultural products in the United States consist of fresh, frozen or processed vegetables and fruits. About 11% are alcoholic beverages, 8.4% - sugar, 7.6% - processed grains, 6.5% - meat and dairy products, 6.4% - coffee, cocoa and their products.
USA — the structure of imports of agricultural products in 2019
USA - the structure of imports of agricultural products in 2019

Production, Consumption and Export of the Basic Crops

Comparison of production, consumption and export of the basic crops in the United States and Ukraine shows that most of the forage and technical crops are consumed within the United States, as opposed to Ukraine which supplies raw materials for the processing and livestock industries in other countries. In the United States, domestic consumption of grain crops is 85.2% of production and 27.2% regarding our country. The share of domestic consumption of oilseeds in the United States is 67.1%, in Ukraine — 77.7% of the total production.
USA, balances of the basic crops in 2019, thous. tons
Ukraine, balances of the basic crops in 2019, thous. tons

All About the Agrarian Super Country

In countries with highly developed economies, the share of the agricultural sector in GDP and in the structure of exports isn`t dominate. And the macroeconomic indicators of the United States and Ukraine do confirm this.
Exports of agricultural products from the USA and Ukraine in 2019
Index
USA
Ukraine
Export of agricultural products, $ bln
136,7
22,1
Relative share of agricultural products in export,%
8,2
44,2
Top-5 export positions of the AIC, $ bln
Soybean - 17.0
Cattle meat, pork - 15.4
Vegetables, fresh or processed fruits - 13.1
Walnut - 9.6
Corn - 9.0
Corn - 5.2
Sunflower oil - 4.3
Wheat - 3.7
Rapeseed - 1.3
Soybean - 1.2

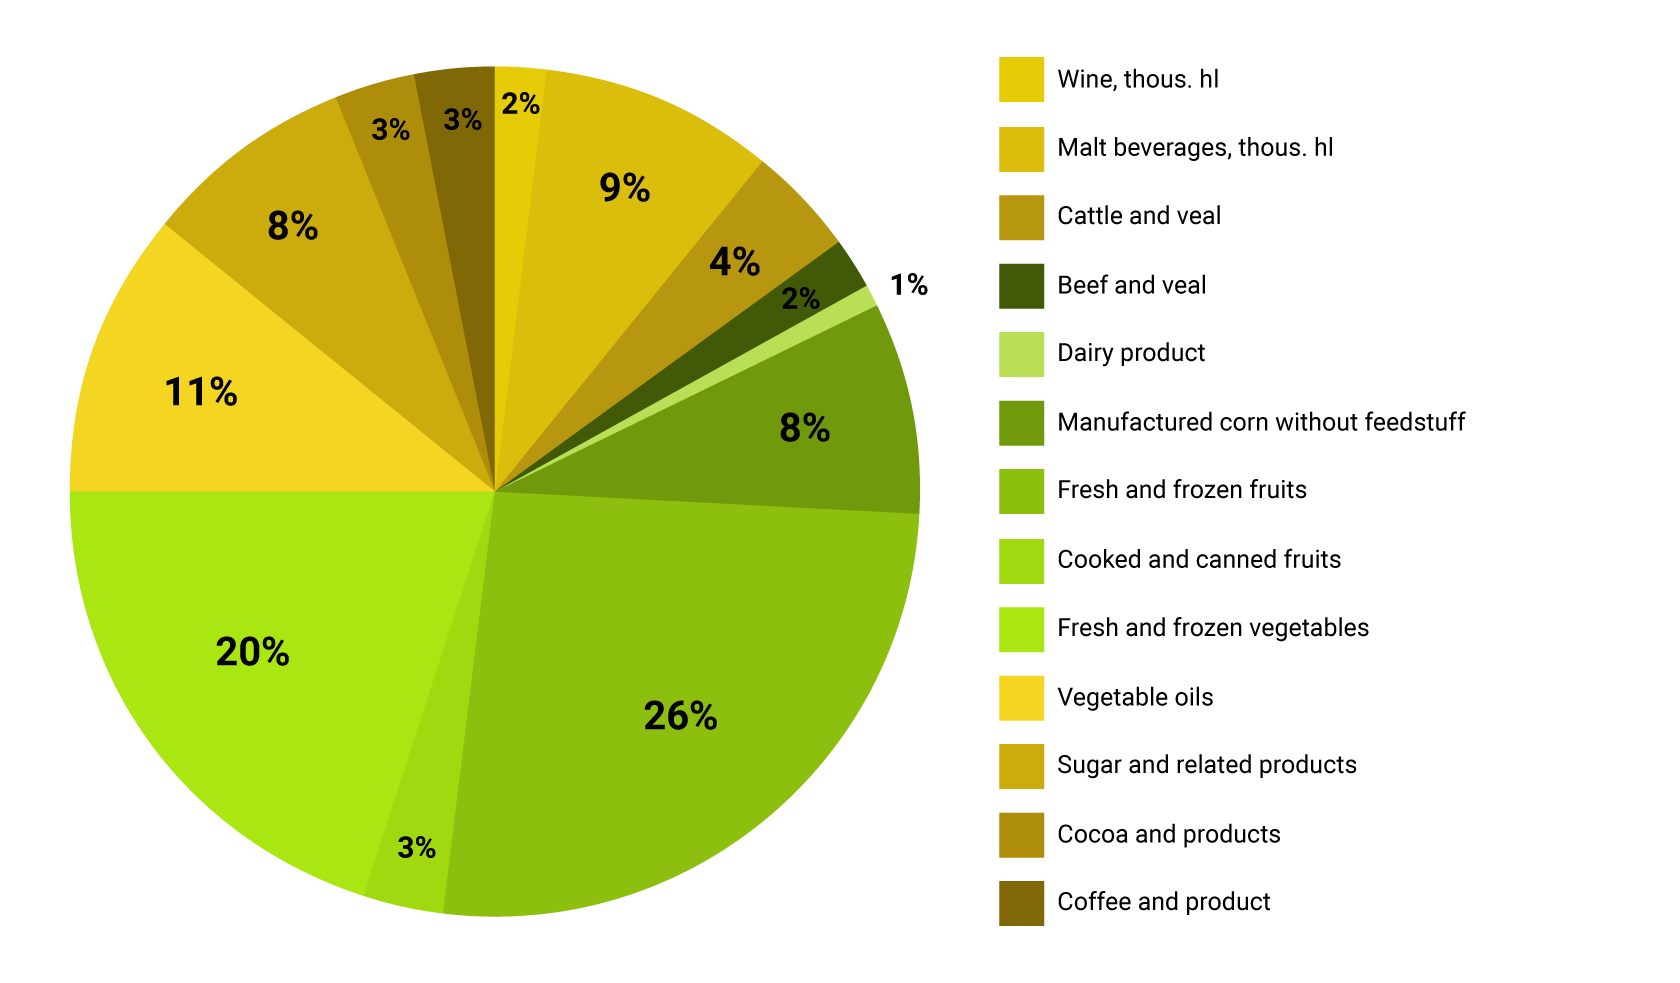
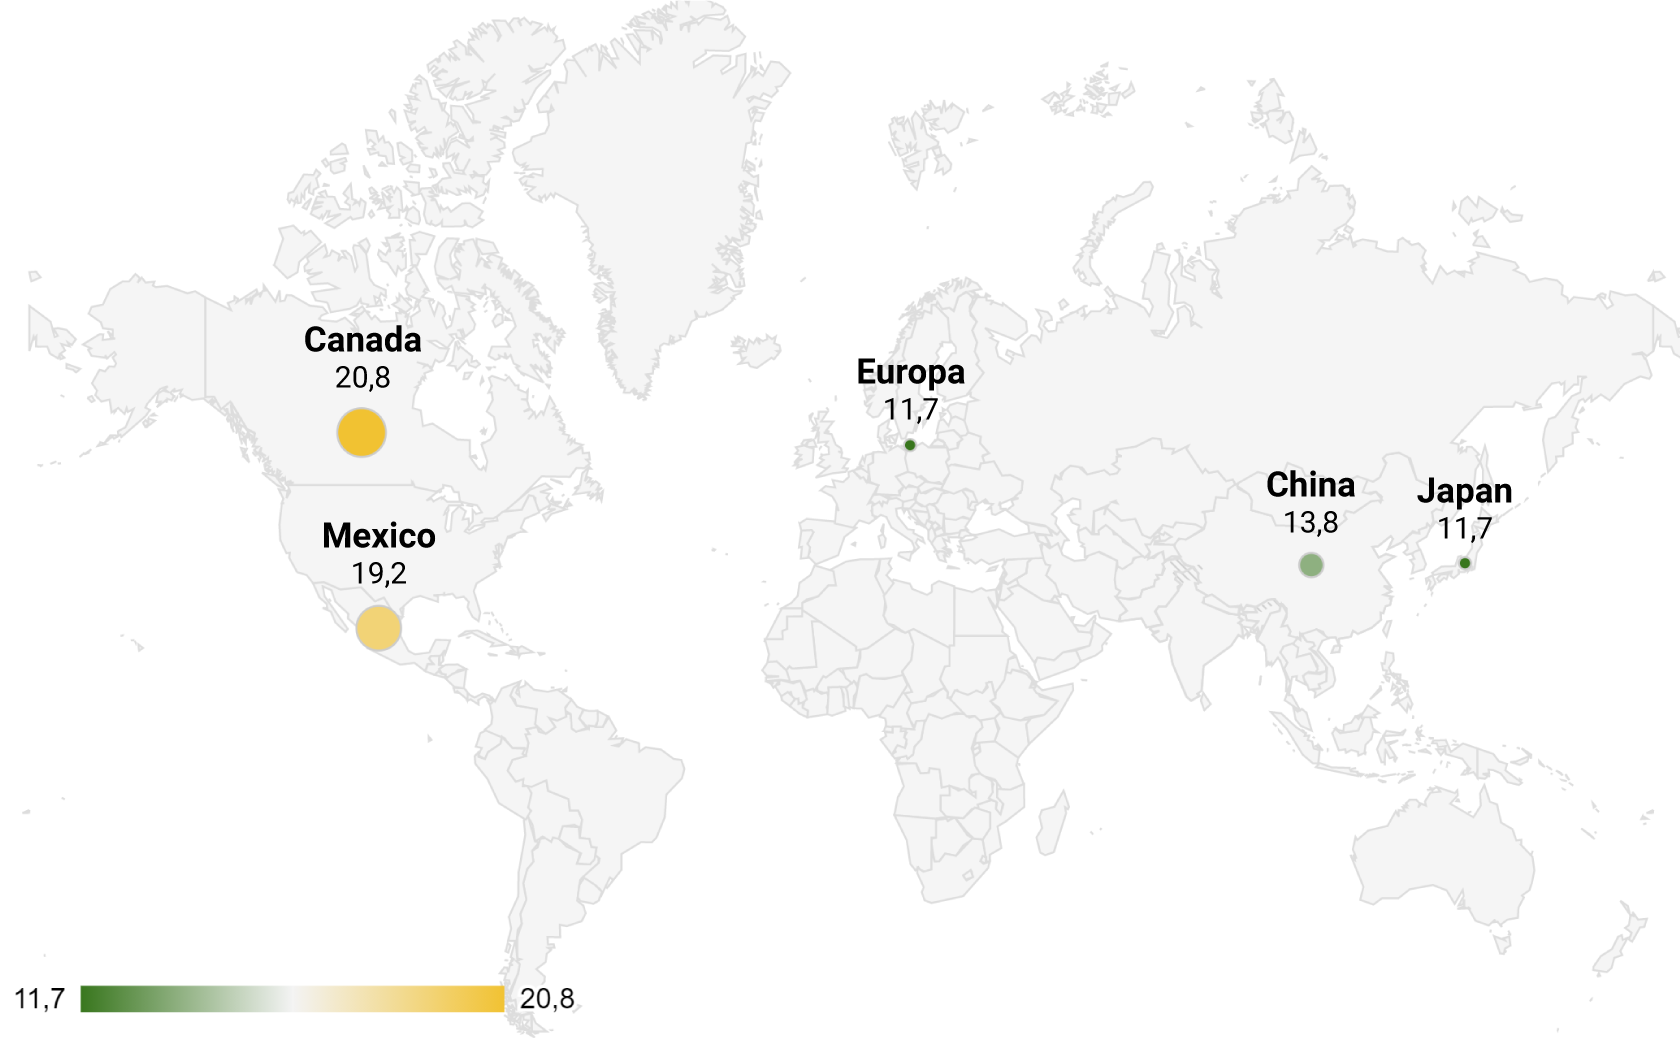
Despite the fact that the total export of agricultural products from the USA in 2019 exceeded the Ukrainian one by 6 times, its share in the gross export is only 8.2%. (For comparison, in Ukraine this figure is 44.2%). The largest position in the structure of US agricultural exports is soybeans with market sales of $ 17.0 billion. At the same time, soybeans occupy only 12th place in the structure of exports of all goods from the United States. In the top ten of high-tech products are electronics, airplanes, electric vehicles, etc.

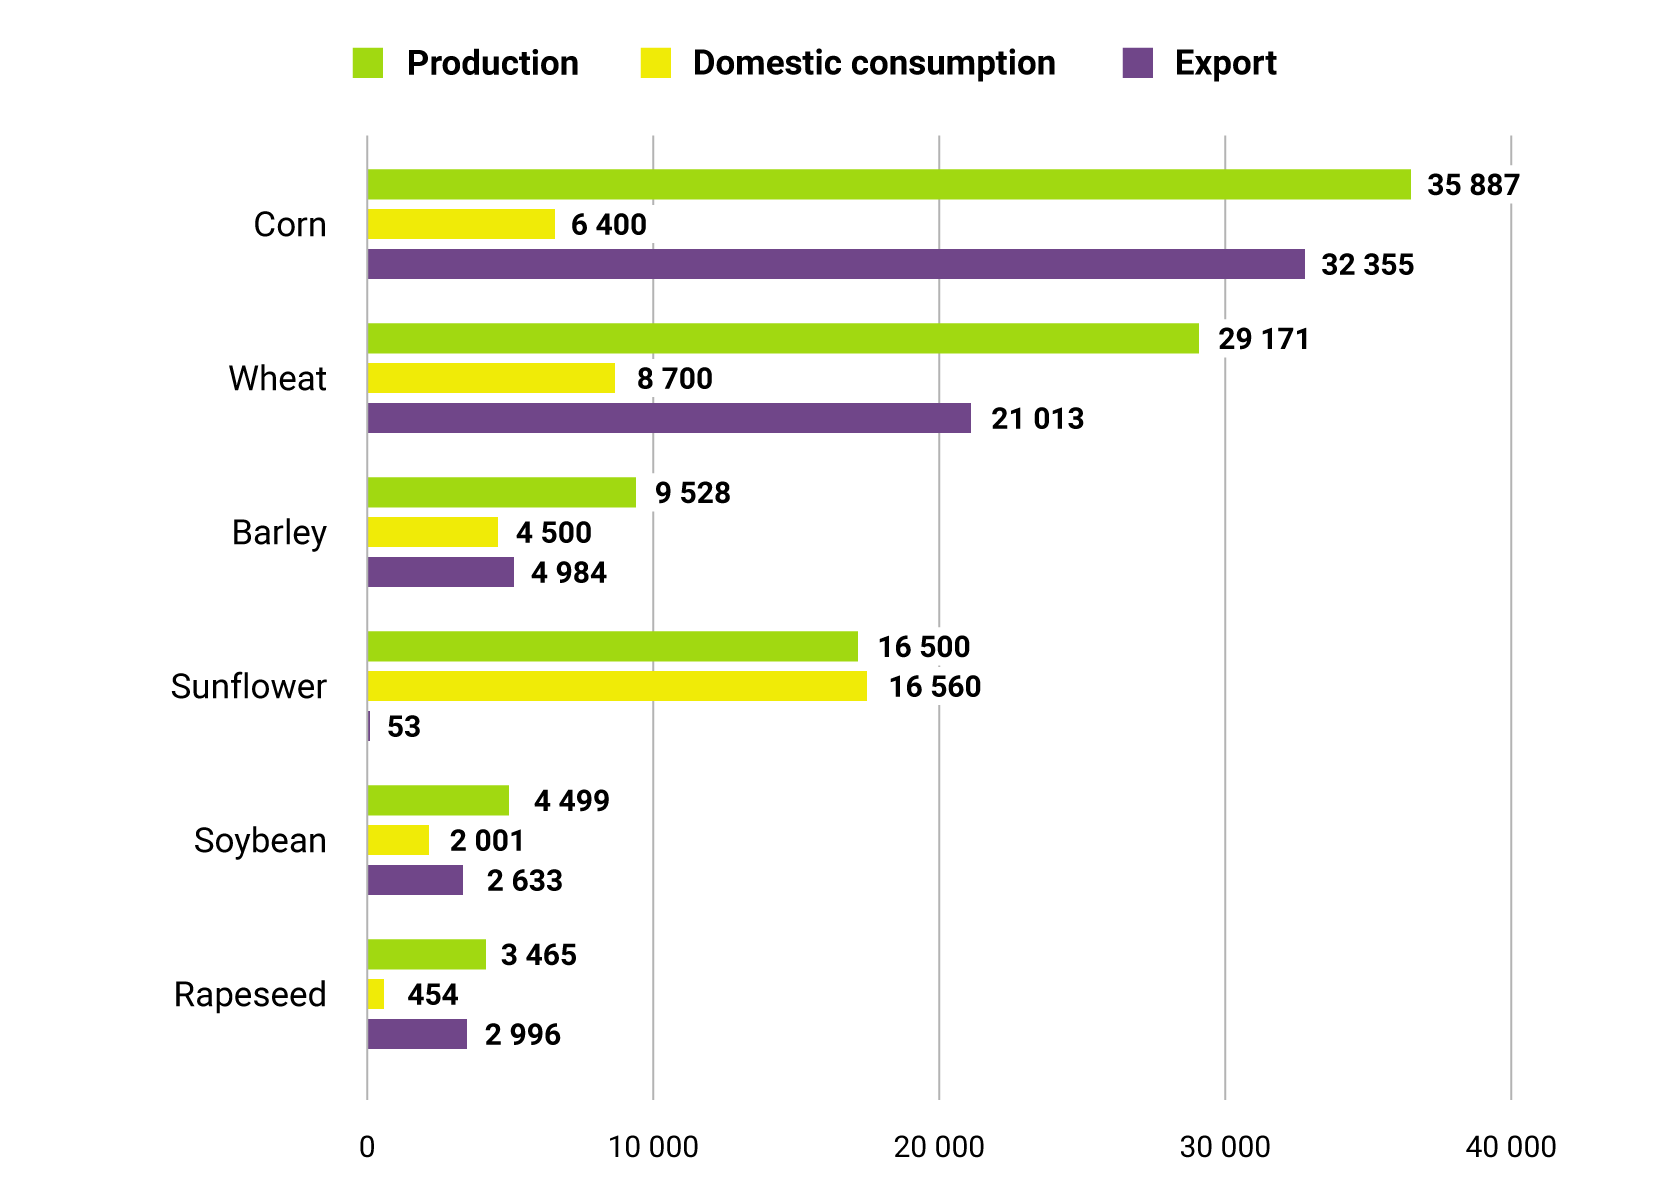
According to the data of the State Customs Service, the TOP-5 export positions in Ukraine looks like this:

  • corn — $ 5.22 bln;
  • sunflower oil of all kinds — $ 4.28 bln;
  • wheat — $ 3.66 bln;
  • iron ore — $ 3.4 bln;
  • semi-finished products from carbon steel — $ 2.87 bln

As a comparison, the top five U.S. export positions according to their Department of Trade and Commerce:
  • machinery and equipment including computers — $ 205.9 bln;
  • fuels and lubricants — $ 199.7 bln;
  • electronics and equipment — $ 173.2 bln;
  • aircraft construction, rocket production (space) — $ 136.0 bln;
  • cars (vehicles) — $ 133.0 bln.
At the same time, it is worth reminding that United States is a country that takes the 1st place in the world in terms of export of grain crops (24.3%), oilseeds — 2nd place (32%), protein meal and press cake — 3rd place (13.6%), meat — 1st place (23.9%). Nevertheless, the agricultural products were not included in the TOP-10 export positions of the country. This is a good case for debunking the myth about the agrarian super country. The officials in "high offices" in good years like to talk about the country’s agrarian power, fantasizing about the impact on geopolitical processes through the global grain supplies and comparing Ukraine with Kuwait or Saudi Arabia. These countries are the world players in the hydrocarbon market and possess the strategic oil reserves.

Speaking of NAFTА, — it is the North Atlantic Free Trade Area between the USA, Canada and Mexico. Taking a look at the top 5 markets for the export of agricultural products from the United States, we see the leading part of the US partners in the NAFTA Free Trade Area.
TOP-5 sales areas for agricultural products in the USA
TOP-5 sales areas for agricultural products in Ukraine
Canada accounts for 15.2% ($ 20.8 billion) of US agricultural exports, Mexico — 14.0% ($ 19.2 billion). China is in third place. The volume of trade with China is even greater than with its strategic ally — the EU in spite of the trade war. The EU and China are also important partners for Ukraine accounting for 33.0% ($ 7.3 billion) and 9.0% ($ 2.0 billion) of total exports. If we talk about the export of Ukrainian agricultural products to neighboring countries, the supplies to Poland take 3.2% ($ 0.7 billion), to Belarus — 2.7% ($ 0.6 billion).

Infrastructure. Grain storage

In the United States, the capacity for one-time storage of grain crops in farms is 365.0 million tons. Elevators that are owned by cooperatives, traders and other market participants hold 310.0 million tons of products.

According to research conducted by North Dakota State University in 2015, farmers try to sell about 40% wheat, 38% corn and 67% soybeans immediately. That is, such part of the crop goes "from field to market", because of small storage capacities in most farms. Among the surveyed farmers (these are more than 2,700 respondents), only 1% had a one-time storage capacity at the level of 13.5 thousand tons.
The size of the farm with a land bank, ha
Average size of grain storage tanks, t
Up to 121.5
708.8
122-303.8
1080
304-607.5
2179.4
607.9 and more
8885.6
North American Export Grain Association provides the following figures for elevator capacity and grain handling terminals in the United States.
Non-farm elevators
Index
Steel silages
Concrete silages
Floor warehouses
Country Elevators
Storage
550-27500 МТ
680-2700 МТ
41000-164000 МТ
Acceptance
20 machines / h or 500 MT / h
Shipment
10 machines / h or 250 MT / h

4-8 wagons / h or 440-880 MT / h
10 machines / h or 250 MT / h

4-8 wagons / h or 440-880 MT / h
10 machines / h or 250 MT / h

4-8 wagons / h or 440-880 MT / h
Unit Train Terminals
Storage
13400-27300 МТ
1400-2700 МТ
41000-164000 МТ
Acceptance
20-40 machines / h or 500-1000 MT / h
Shipment
10 wagons / h or 1100 MT / h
10 wagons / h or 1100 MT / h
Barge Terminals
Storage
13400-27300 МТ
1400-2700 МТ
41000-164000 МТ
Acceptance
20-40 machines / h or 500-1000 MT / h
Shipment
500-1000 MT / h
500-1000 MT / h
500-1000 MT / h
Export Terminals
Acceptance
Railway: 750-1200 MT / h
Barge: 750-2500 MT / h
Railway: 750-1200 MT / h
Barge: 750-2500 MT / h
Railway: 750-1200 MT / h
Barge: 750-2500 MT / h
Shipment
1500-3200 MT / h
1500-3200 MT / h
1500-3200 MT / h

Transportation

The United States of America is not only the largest agricultural market, it is also a powerful logistics system that provides storage and movement of agricultural cargo. According to USDA AMS data, the share of vehicles in agricultural logistics is constantly growing, following an increase in crop and livestock production in the country, reaching 350 million tons per year.
Transportation of agricultural cargo by type of transport,%
In the USA, the share of the railway in the transportation of agricultural products corresponds to the indicator in Ukraine. River transportation in the States is more developed. As in Ukraine, railways and river transport dominates in export (delivery from production regions to ports).
Transportation of agricultural cargo in the USA by destination,%
Despite the significant share of transportation that falls on road transport on domestic routes, according to a study by North Dakota State University, the average transport leg is: for wheat — 46 km, for corn — 40 km, for soybeans — 35 km.
Infographic from the USDA shows that the short transport leg for road transport is due to the large number of processing plants located within the growing belts. Also, a large number of transshipment terminals allows not to "drive" a truck across the country but to use a developed network of rail and river transport. The railway mainly works towards the delivery of agricultural goods from the regions of production (belts) to the ports of the Gulf of Mexico and towards the western regions of the country, where there is no grain production, but there is consumption. Inland water transport is concentrated on two river systems. The Mississippi River, with its tributaries, is the channel for the delivery of grain to the ports of the Gulf of Mexico, in particular, to the port of New Orleans. In the Northwest direction, grain logistics is developed on the Columbia River system and its tributary Snake, providing delivery from the wheat belt to the ports of Portland, Seattle, etc.

Transshipment

The main export gateway for the US agro-industrial complex is the Gulf of Mexico, and the port of New Orleans accounts for 37% of the country’s total exports (according to the Profiles of Top US Agricultural Ports report from AMS USDA). If we take the volumes in physical terms, more than 70 million tons of agricultural cargo is shipped through the port of New Orleans per year, the ports of the North-West coast are in second place in this indicator, the largest volume of transshipment in this region is provided by the port of the city of Kalama — more than 10 million tons per year. In total, the ports of the Northwest — Seattle, Portland, Tacoma, Calama, Longview and Vancouver — export 37.3 million tons, or 24.7% of the country’s agricultural exports. For example, in Ukraine for 2019, which is a record year in terms of agricultural exports, the entire port transshipment in the export direction (according to the USPA data) amounted to 52.8 million tons, and the leader among ports with a result of 15.6 million tons was the Nikolaev Seaport.
Главные экспортные ворота для АПК США

Organization of an agricultural business in the USA

In the minds of most compatriots, the American farm is a red-painted barn, around which there are several metal silos, and the picture is complemented by the John Deere M-series mini-tractor, which has been produced in the country since 1947. Traditionally, agriculture in the USA is a family business … It is dominated by small farms that have been passed down from generation to generation. 98% of all US households are family-owned. Also, farms include farms that are classified as household plots in Ukraine. In 2019, there were 2.02 million farms in the United States, the land bank owned by farmers amounted to 363.5 million hectares or 89.6% of all farmland. Also, family farms account for 86% of the country’s agricultural products.
The number of farms in the United States by income.
According to the USDA Economic Research Service
Farms with an income of up to $ 10 thousand per year make up 51% of the total number of players, at the same time they account for only 9.4% of agricultural land. Enterprises with an annual income of more than $ 1 million make up 3.9% but have the largest land bank — 92.3 million hectares, or 25.4% of the total. That is, there is no significant concentration of land in the same hands, as in Ukraine. Although in the USA the process of business enlargement is constantly taking place — the number of farms is decreasing, and the average size of the enterprise’s land bank is growing. Last year alone, the number of farms in the country has decreased by 5.8 thousand. These trends are associated with the development of the efficiency of large farms. According to the US Department of Labor, the number of people working in agriculture increased from 2.25 million in 2011 to 2.43 million (or 8%) in 2019. Thus, it can be argued that the consolidation of farms helps to develop the industry more efficiently, as evidenced by the constant growth in the production of agricultural products. Accordingly, the demand for labor is growing.
But this trend is becoming a real tragedy for small family farms, which cannot withstand the competition and are often forced to work at a loss in order to maintain a farm that is inherited in the 3rd or 4th generation. A significant number of small farm owners are forced to work "on the side" to ensure the survival of the family and keep the farm from bankruptcy. This is the other side of the American agro-world, which is little talked about in Ukraine because Ukrainian business tourists will not be shown a farm that barely makes ends meet.

The fragmentation of farms and the land bank pushes farmers to a logical step — to unite in cooperatives. According to NASS USDA, in 2018 there were 1.8 thousand cooperatives in the United States, which united 1.9 million farms (almost 94%).

In general terms, the agricultural market functioning model is as follows:
Business organization. Market functioning model
Farmer
Landbank 300-600 hectares
Farmers
cooperative
Trader
Export
Farmers are engaged in the production of agricultural products, which are then taken to elevators and transshipment terminals owned by cooperatives. Cooperatives take over storage and transportation by river or rail, forming consignments of the desired size. Cooperatives are also involved in commercial activities — the sale of agricultural products to global grain traders. Some cooperatives, in order to "build muscle", unite and can work without large traders. For example, one such alliance is the Comark Equity Alliance. This is an association that includes about 20 thousand farmers. The total grain storage capacity of Comark Equity Alliance is 3.8 million tons. By the way, such "multi" as Cargill and ADM, at one time grew out of farmer cooperatives.

Land market

Many have heard about the significant plowing of the territory of Ukraine and the fact that we are in first place in the world for this indicator.
According to the UN FAO, agricultural land in the United States accounts for about 44% of the land, in Ukraine this figure is an incredible 72%. If we talk purely about arable land, it occupies 16% of the continental territory of the United States and 54.5% - in our country.
The structure of the farmland itself is also different. In the United States, the largest share is occupied by pastures, thanks to developed livestock farming and significant flat areas suitable for grazing. By the way, the main form of organization of farms engaged in raising farm animals is the ranch.
In the United States, the state owns 28% of the country’s land fund, versus 18% in Ukraine. At the same time, arable land is concentrated in the hands of private owners, and the federal government and the states have rights to part of the land occupied by pastures and forests. Large state landholdings (in some states more than 40% of the land) are explained by the presence of significant protected areas. They are mainly concentrated in the West of the country and in Alaska.
US land use by USDA
A number of trends are clearly visible in the structure of land use in the United States. In recent decades, the areas of forests and arable land have been constantly decreasing, at the same time, the territories of cities are growing (the population migration to urban agglomerations effects), the share of special-use lands — infrastructure, military bases, etc. — is increasing. Pasture areas remain stable.

Remember the trend of farm enlargement in the United States? According to the USDA Economic Research Service, the average age of farmers is growing and is now 55 years old. There is also a growing number of owners who, upon reaching retirement age, abandon business activities and lease their land. As a result, the share of leased land increased to 38%. The National Young Farmers Coalition predicts that two-thirds of farms will change owners in the next 20 years due to the reluctance of the younger generation to continue farming.
According to the NASS USDA, in 2019 the average cost of agricultural land renting was 345.8 $/ha, the average purchase price was 10,127 $/ha. In Ukraine, according to the State Geocadastre in 2018—2019, the average cost of state land renting was 126.2 $/ha, and the cost of buying shared land in the gray market, according to VoxUkraine estimates, was 1404.2 $/ha.

American land is also loved by big business owners. Recently there was news that Bill Gates is one of the largest landowners in the United States. According to the journalistic investigations of The Land Report, the investment fund Cascade Investments, owned by the Gates family, has been buying up farms for several years and accumulated 98.0 thousand hectares of land. Surprisingly, huh? It turns out that this can happen not only in Ukraine. But this is not the limit. According to the annual rating, made by the aforementioned publication, the absolute leader among US landowners is John Maloney, chairman of the board of directors of the media holding Liberty Media. He owns a land bank of 891 thousand hectares.

Governmental support

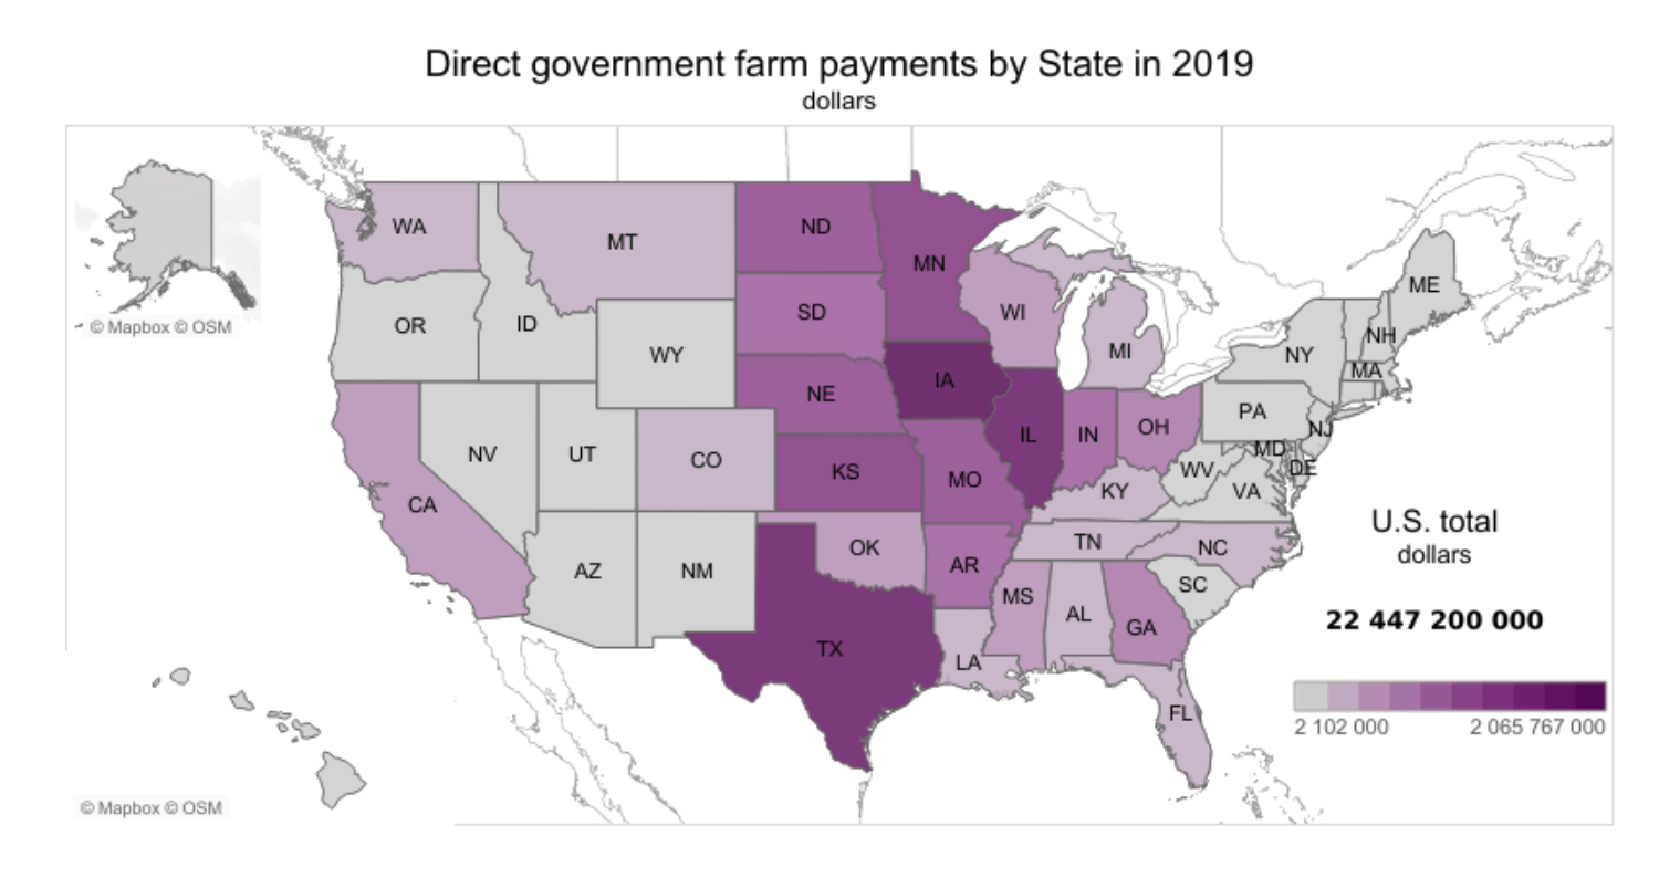
In the United States, the bulk of government agricultural support programs are carried out through the Commodity Credit Corporation and the Farm Service Agency, which are structural divisions of the United States Department of Agriculture (USDA). Through its structural divisions, the USDA implements several dozen programs aimed at supporting farming activities, stimulating exports, preserving the environment, careful use of soil, supporting the production of certain types of products, etc.

In 2019, the US government allocated $ 22.4 billion to support the agro-industrial complex, which is 63.5% more than in 2018. According to preliminary estimates, in 2020, the total amount of state support for the American agricultural sector will amount to $ 44.5 billion (an increase 98.7%). The increase in the amount of state support by 2.2 times was due to an increase in expenditures for two programs:

  • support for farmers affected by the loss of sales markets as a result of trade wars launched by the former administration of D. Trump, funding amount — $ 17.9 billion in 2019−2020;
  • compensation for losses caused by natural disasters, funding amount — $ 33.9 billion in 2019−2020.
The distribution of state support to the agro-industrial complex by the state is as follows:
Распределение государственной поддержки АПК по штатам
The bulk of payments falls on the states that are located within the corn and wheat belts, as well as in Texas, with developed livestock farming. A prominent place among the recipients of state aid is also occupied by California, which is the leader among the states in terms of growing fruits and vegetables.

In Ukraine, in 2019, the total amount of state aid to the agricultural sector, anticipated in the state budget, amounted to $ 242.4 million (at an average annual rate of UAH 25.8/USD, according to the NBU), that is, 90 times less than in the United States.
Structure of expenditures for state support programs for the agro-industrial complex in the USA and Ukraine in 2019
Despite a significant amount of support, an absolute minority of American farmers receive assistance from the government. According to the ERS USDA, in 2019 69% of farms did not receive any type of assistance from the state. In addition, specialized associations complain about the fact that large farms receive the most subsidies. In particular, under the Federal Insurance Program in 2019, 68% of all aid was received by medium and large farms, which account for only 7.7% of the total number of farms in the United States.

Financing of the agro-industrial complex

American farmers are doing fine with their finances — the system demonstrates super-liquidity. The total amount of assets owned by US farmers is more than $ 3.0 trillion, and equity capital is $ 2.6 trillion, while the total liabilities are only seventh of assets, or $ 0.4 trillion.
USA, financial indicators of the farm, $ billion
USA, financial indicators of the farm, $ billion
Structure of farm liabilities in the USA, 2019, $ billion
The agricultural lending market in the United States is well developed. In the structure of liabilities, the largest share is owed to Farm Credit System — $ 178.1 billion and to commercial banks — $ 168.2 billion, or 42.5% and 40.2%, respectively. By the way, in Ukraine, according to the NBU, in 2019 the total amount of loans in the agricultural sector amounted to UAH 61.6 billion or $ 2.4 billion when recalculated at the average annual NBU rate of UAH 25.8 / USD.
And if everything is clear with commercial banks in the United States, a closer look should be taken at the activities of the Farm Credit System. It is a cooperative that brings together farmers, ranchers and other agribusiness representatives. Lending activities financing is carried out by issuing farm loan bonds, which are placed on the country’s financial market. Interestingly, these bonds have a high AAA credit rating, and therefore are in great demand among investment funds. Securities (bonds) are issued and regional divisions that are in each state of the country are financed through the financial institutions that are part of the Farmer Credit System. Regional divisions are engaged in loans service to farmers. As for the terms of loans, or rather interest rates, Farm Credit System finances farmers at 1.25−2.5% per annum (depending on the loan type). State loan programs from the Farm Service Agency, which is a structural unit of the USDA, provide loans to agricultural producers at 1.38−2.63% per annum.
Completed withDisqus